Business is
overwhelmingly location centric. After all,
companies generally sell goods and services to other
companies and people who all have an address, be it
an office, warehouse or home. It
makes perfect sense then that to better understand a
business, that business needs to leverage the power
of location to help make faster and more informed
decisions. Indeed, the intuitive power of maps
allows businesses to see trends and patterns which
are often hidden inside tables of multi-dimensional
data. The following scenarios demonstrate how
location intelligence can help enhance business
intelligence products by providing innovative and unique
visualization methods that combine the best of
spreadsheets, charts, graphics and maps.
|
|
|
|
The
primary goal of business intelligence is to give
managers the tools they need to make sense out of
the data that drives their business. This data can
be very complex, coming from disparate sources and
multiple business units. Traditional business
intelligence tools focus on organizing that data and
mining it to pull out key aspects which provide
insight. For example, a manager may want to see the
quarterly sales figures of a range of products
across the country. Once the query is run this data
can be visualized as graphs and charts, such as
those found in executive dashboards. In most cases
this data is viewed based on it's numerical value,
such as the number of sales and or volume etc. While
certainly easier to comprehend at a glance than rows
and columns of data, charts
and graphics still fall short in providing a
comprehensive enterprise-wide view of the health of
a business. The key missing variable is the 4th
dimension which is found in location data that
provides greater and more intuitive clarity across
the board. For example, looking at the same
data now on a map truly provides a big picture view
which is missing in traditional business
intelligence visualization programs. This location
intelligence visualization allows managers to more
easily focus on where the business is performing or
underperforming and where new opportunities and
trends lie. Conceptual data that pie charts and
bar graphs can't simply provide. In the following
sample illustrations, location intelligence has been
applied to a number of existing business
intelligence implementations, revealing even greater
clarity and comprehension to the data resulting in
the ability to make better, faster and more informed decisions that ultimately save companies time and
money while helping improve bottom line
efficiencies.
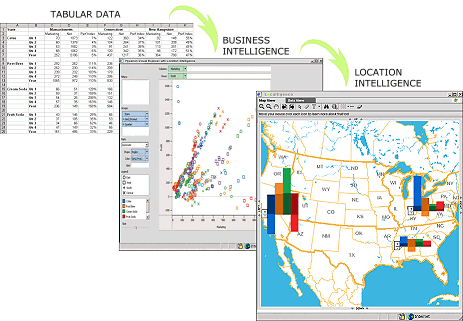
Illustration A: This example shows how the same data
can be viewed as a spreadsheet, a
chart or as a map which provides a more intuitive and
flexible visualization.
Click to zoom in
Illustration B: This example demonstrates drilling
down into a map spatially, and then switching to a
data view to see the underlying information.
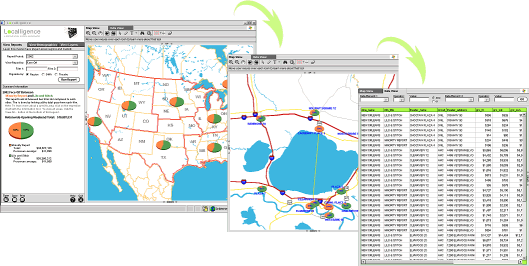
Click
to zoom in 
|
|